


Have you ever wondered if the market's ups and downs today might actually lead to smarter gains tomorrow? Some early signs suggest calmer trading is on the way. Traders are keeping a close eye on the VIX index (a tool that measures how wild the market may be) and are hoping a drop means less nervous trading.
At first, there were jitters over trade news and moves by the Fed. Then little wins, like Netflix rising after a great earnings report, helped boost investor confidence. It feels a bit like watching dark clouds break apart and letting in sunshine. This post explains why these early signals might lead to a brighter outlook.
Market Volatility Today: A Bright Outlook
Today, the numbers are telling a hopeful story. The VIX index, which checks current S&P 500 options (basically, short-term bets on stocks), hints that things might calm down over the next month. Early Tuesday, worries over trade and Fed moves sparked some jitters, but stocks soon started climbing steadily.
Netflix caught some eyes by gaining 1.53% after a solid earnings report. It goes to show that even small wins can boost investor mood. As one observer put it, "After a rocky start, the market's gradual recovery felt like spotting a break in the clouds on a gloomy day."
- Stock recovery signals
- VIX movement
- Major index updates (S&P 500, Nasdaq)
- ETF activity levels
- Commodity price shifts
All these signals create a picture of cautious optimism. Investors saw stocks slowly picking up, like they're healing bit by bit. The VIX dropping means less fear after a shaky start, and even the big indexes like the S&P 500 and Nasdaq posted small gains. Meanwhile, changes in ETF actions and commodity prices, especially gold reaching new highs, show that the market is tough and resilient. One analyst even said, "The market feels like it's waking up after a long, restless night," a feeling many can relate to.
In short, today's figures are worth a close look. The trends indicate that despite the early worries, signs of recovery are strong. Quick price moves give investors useful clues to adjust their strategies. Everything seems to lean toward brighter days ahead, hinting that today's ups and downs might even power tomorrow's gains.
Technical Analysis of Market Volatility Today: Patterns and Indicators
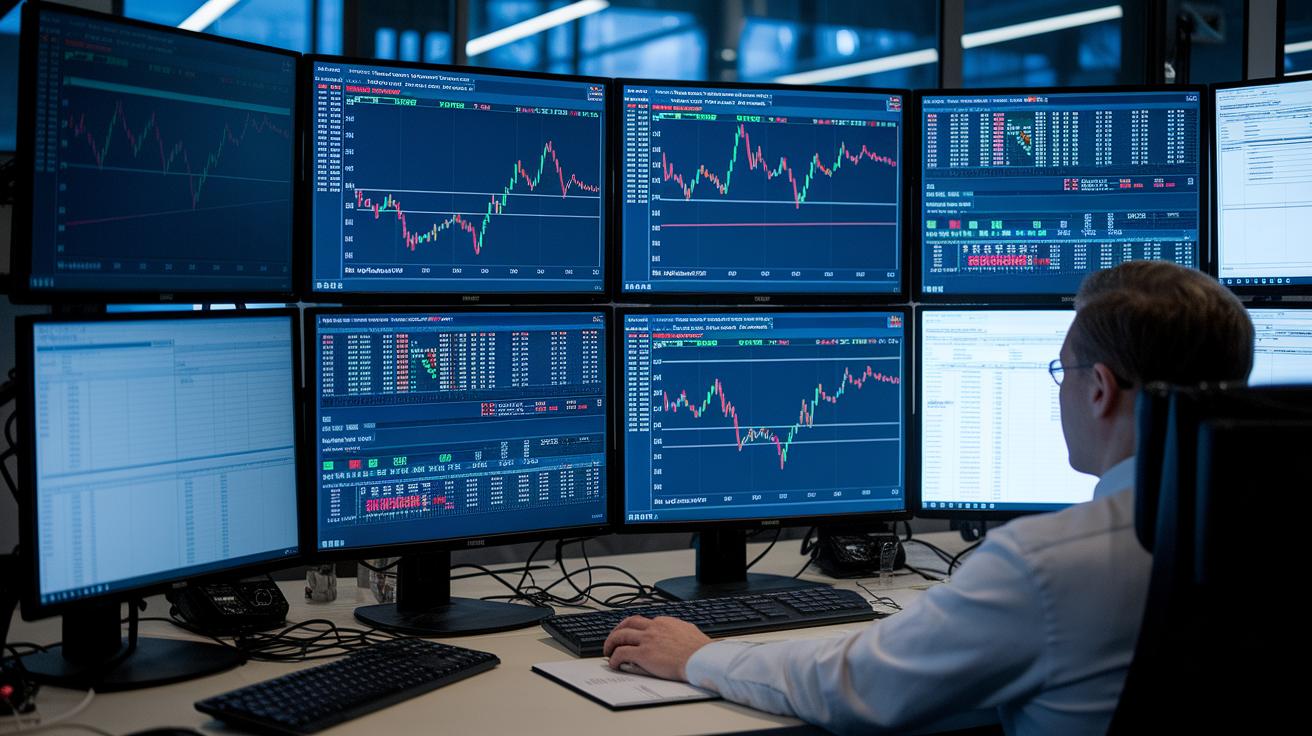
Market watchers are leaning on technical methods to figure out how wild the market is getting right now. They use tools like moving averages (which smooth out price changes), oscillators, and volume anomaly indicators to capture a quick snapshot of what's happening. These tools help us see trends in price movements and get a feel for investor mood based on recent S&P 500 options data. One big player here is the VIX, which gives us a hint about market jitters for the next 30 days. It’s like a clear signal that pops up when prices start shifting quickly.
| Indicator | Description | Application |
|---|---|---|
| VIX | Measures expected market volatility | Checks short-term risk |
| Moving Averages | Smooths out price data | Helps spot trends |
| RSI | Shows momentum (the speed of price changes) | Signals when conditions are overbought or oversold |
| MACD | Tracks how moving averages converge | Highlights possible trend reversals |
By using these tools, experts can map out clear patterns even when prices bounce around a lot. A mix of moving averages and oscillators, along with careful chart pattern recognition, gives traders a special window into price actions. Analysts keep a close eye on these indicators to catch small shifts in investor mood and to predict what might happen next in the market. This hands-on approach helps traders adjust their positions on the fly as changes become visible in real time.
Investor Strategies for Market Volatility Today: Risk and Opportunity
When market conditions shift quickly, investors need a mix of quick moves and careful planning. Studies over many years show that skipping just a few of the best-performing days can really hurt long-term gains. This means that snapping decisions often mess up a solid plan. Prices jump around, emotions flare up, and trying to pick the perfect moment to buy or sell rarely works out. Savvy investors stick with a steady plan, using clear data from charts (graphs of past prices) to avoid hasty mistakes.
- Keeping a mix of different investments
- Using safe bets like trusted bonds or stable assets
- Watching clear signals to pick the right time to act
- Following a calm, long-term plan
In simple terms, this approach means setting up a mix of investments that can ride out short-term storms while still building for the future. Many investors lean towards safe havens, such as certain bonds or commodities (physical goods like gold), to help cushion unexpected drops. At the same time, keeping an eye on clear market signals helps guide decisions without relying on gut feelings. Overall, sticking to a plan tends to be the best strategy for managing both risks and opportunities, especially when the market can change in an instant.
Global Influences on Market Volatility Today: Economic and Political Dynamics

Political decisions are making a big impact on the ups and downs of the market these days. There have been many talks about problems with the Fed and changes in trade rules that bring a lot of uncertainty. Investors are watching these political events like a sudden change in weather, which makes them rethink their risks.
Changes in money policies and hints about interest rates add to this feeling. Even small moves by central banks (organizations that control a country's money) can shift the market, much like a gentle breeze steering a kite. Every update, whether it's expected or a surprise, can spark quick decisions from investors.
On top of that, global trade talks and disputes add extra layers to market changes. Issues that cross country lines form a puzzle, and each piece of news points to what might happen next. Investors try to put these pieces together to see how the local market might react in the coming days.
Market Volatility Today: Future Outlook and Key Considerations
Recent surveys show that missing those key rebound days can hurt long-term gains. New data is pointing to market shifts that older studies missed, and experts are noticing early signs of recovery. In simple terms, keeping up with real-time economic trends might help investors tweak their strategies more effectively.
Analysts are now looking into everyday spending habits and changes in production numbers that weren't discussed before. New reports also mention things like shifts in trade volumes and energy output that could impact upcoming market moves. Here are a few key ideas:
- Watching fresh economic indicators closely
- Deciding the best times to jump in or step out of the market
- Diversifying investments to spread risk
New models built on the latest tech and up-to-date international trade data are making future predictions clearer. These smart tools are helping to spot when the market might adjust and hint at shifts in asset performance. For example, one expert shared a surprising fact: "New machine learning models predict recovery phases in sectors like green energy and biotech even before traditional reports show change."
Final Words
In the action: the article broke down real-time price shifts, technical analysis, investor risk management, global influences, and future outlook in clear, bite-sized sections.
Key takeaways:
• Real-time data and charts guide short-term moves.
• Strategic, long-term approaches refine risk management.
• Global events shape today's financial landscape.
Each point builds a framework for making informed decisions. When addressing market volatility today, these insights empower professionals to act with confidence and purpose.
FAQ
What is the current volatility of the stock market?
The current volatility of the stock market shows how much prices swing each day. It reflects real-time fluctuations and captures the mood of investors through indexes like the VIX.
Why is the market so volatile right now?
The market is so volatile right now because recent trade concerns and shifting economic policies have led to rapid price changes. This drives uncertainty and impacts investor confidence.
How to check market volatility?
Checking market volatility involves looking at indicators such as the VIX and major stock indices. Many websites and apps offer real-time updates to help you gauge market risk.
What is the volatility of the S&P 500?
The volatility of the S&P 500 is measured by how much its prices change over time. This movement is often tracked by the VIX, which helps reflect short-term investor expectations.


