

Ever notice how one small shift in crypto can burst into something huge? The crypto market can feel like a wild roller coaster ride, full of unexpected turns. Bitcoin has a set number of coins, and traders often make snap decisions full of emotion. These choices can push prices way up or drop them down in just moments. Sure, things seem unpredictable, but that unpredictability can create chances for big rewards. This post digs into the hidden forces that cause these rapid moves and shows how staying alert might open the door to exciting opportunities in the crypto world.
Core Drivers Impacting Crypto Market Volatility
Crypto markets can flip in a flash. Bitcoin, for example, only has 21 million coins, so its rarity can push prices up or down quickly. Traders often let feelings like fear, hope, or greed guide them, which only makes the ride bumpier. And since trading never stops, news or global shifts can change things in moments. No wonder many traders keep a close watch on these rapid shifts.
There are several factors that steer these wild moves day after day. Think of these key drivers:
| Factor | Description |
|---|---|
| Supply Constraints | Limited coins like Bitcoin create quick price jumps |
| Investor Sentiment | Feelings such as fear and greed sway market actions |
| Regulatory Announcements | New rules can suddenly shift prices |
| 24/7 Trading Effects | Continuous trading means news hits instantly |
| Market Manipulation | Some players can nudge or exaggerate price swings |
These factors mix together to push prices in surprising ways. When new rules pop up or manipulation tactics come into play, prices can change fast. The nonstop trading and strong emotions make it tough to rely on traditional ways to measure volatility.
Because of all these forces, traders and investors really need to think about risk. Quick price changes from limited supply and strong emotions mean you must stay alert and act fast. Even a tiny bit of news can shift market dynamics. It might seem risky, but if you're prepared to keep up, the rewards can be pretty thrilling.
Crypto Market Volatility: Exciting Potential Ahead
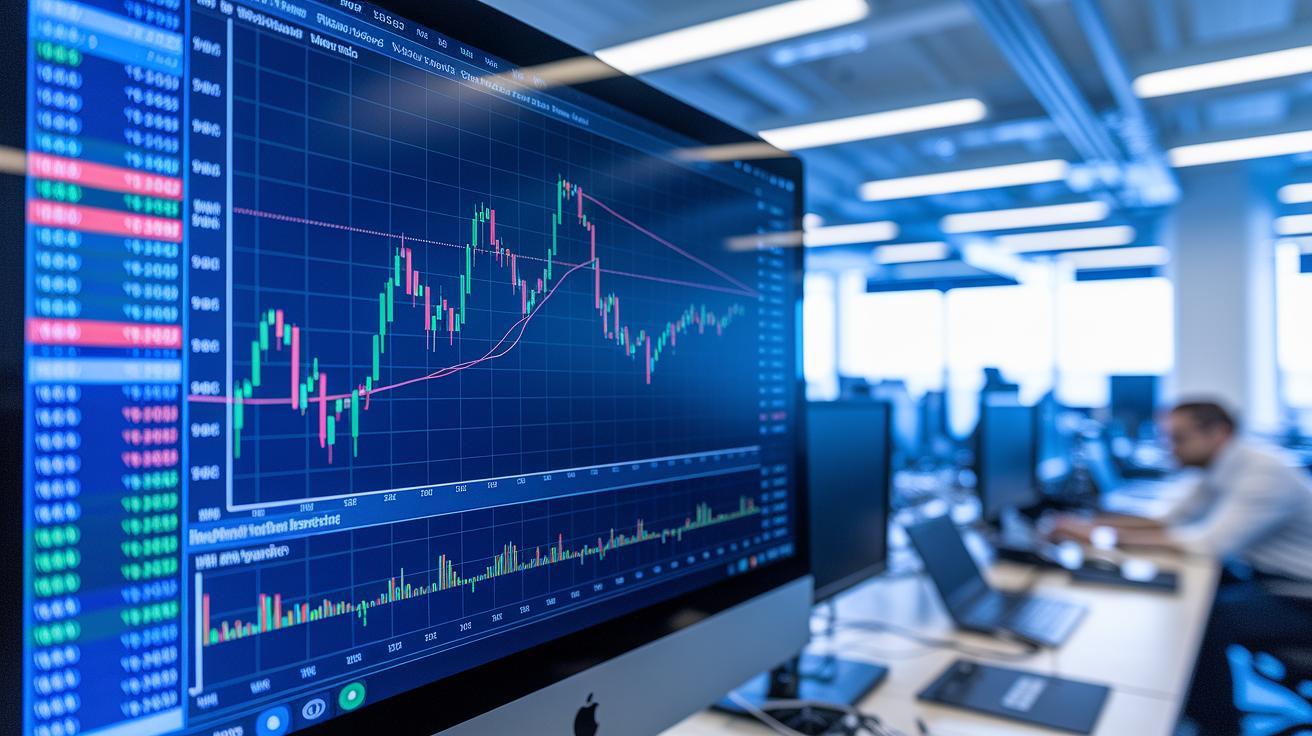
Technical tools like Bollinger Bands and the Average True Range (ATR, a measure of price swings) really change how we see crypto market ups and downs. Bollinger Bands work by using a simple moving average along with lines that show how far prices spread out. ATR shows the average spread of price moves. These tools give traders a better feel when the market suddenly changes. For instance, think about how, once upon a time, people believed prices moved in a smooth and predictable way. Then crypto came along and proved that wasn’t true at all.
| Indicator | Function | Trading Application |
|---|---|---|
| ATR | Shows average price moves | Highlights times of big changes |
| Bollinger Bands | Shows how prices spread | Helps spot where prices might flip |
| Moving Averages | Smoothes out price data | Helps see the direction of trends |
Many trading systems today also use these tools along with websites like Tradingview to set off signal alerts. With data from ATR, Bollinger Bands, and moving averages, these systems can guess when the market might get rough and even tell traders when to buy or sell. This kind of technical review helps guide daily decisions and can alert people to new chances as the market gets more active. Some traders even use extra math tricks to fine-tune their plans. When these signals line up with what traders feel is happening, it creates some really exciting opportunities for those ready to jump on rapid changes and make the most of the unpredictable nature of digital assets.
Implementing Risk Management in Crypto Market Volatility
Managing risk is really important when crypto prices can jump or drop in minutes. Think of it like packing a little survival kit before you head out into wild weather, a bit of planning goes a long way.
There are some simple steps you can take to protect your investments even when the market feels jittery. Many traders use a mix of tools such as:
- Diversification
- Stop-Loss Orders
- Technical Analysis (learning from charts and trends)
- Real-Time Market Updates
- Position Sizing
Diversification spreads your risk around so that a drop in one area won't wreck your whole portfolio. Stop-loss orders work like a safety net by automatically selling your positions if prices fall too much. Technical analysis helps you see when conditions might get tight, and real-time market updates (like checking the daily weather report) keep you in the know. Position sizing lets you decide just how much to invest based on the risk level, imagine packing only what you need for a short walk instead of a long trek.
In truth, even though crypto markets can feel as sudden as a surprise downpour, smart planning and timely moves can help you navigate through the storm with a bit more confidence.
Historical Trends and Technical Insights on Crypto Volatility
If you rewind to the early crypto days, things were really unpredictable. The market felt like a wild roller coaster ride, mostly because it was still finding its feet and many traders were just starting out. Back then, new rules were being written on the fly, and any shift in tech or regulations could send prices soaring or dropping in a flash. Think of it like a sudden gust of wind on a calm day. The main factors? A shaky market, fresh regulations, cool tech breakthroughs, and investors who were still figuring things out.
Today, we have handy tools such as Bollinger Bands, ATR (a simple way to measure how much prices jump around), and moving averages to give us a snapshot of the market in real time. These techniques mix up past lessons with live data to help us see what's happening now. For example, when Bollinger Bands tighten, it's like noticing dark clouds gathering before a sudden summer shower , a little hint that prices could burst upward soon.
Looking ahead, traders blend old market lessons with current signals to get a sense of what might come next. This mix helps spot patterns, whether it's a calm period or a sudden leap in prices. It’s a bit like checking a weather report where familiar clues suggest the day’s forecast, even though a surprise might still pop up.
Final Words
In the action, this article broke down the factors behind crypto market volatility. We covered how supply limits, investor emotions, technical signals, and risk control shape market swings. It also gave a look at past trends and future hints to help you see the bigger picture. The discussion balanced clear strategies and real examples, letting you grasp the market's rapid shifts. Keep these insights in mind as you face the dynamic world of the crypto market volatility, and stay positive about upcoming opportunities.
FAQ
What does a crypto volatility tracker do?
The crypto volatility tracker monitors daily price swings and offers insights into rapid value changes. It helps traders spot moments when buying or selling might be favorable.
What is shown on a crypto market volatility chart?
The crypto market volatility chart displays real-time price fluctuations and trends. It provides a visual cue to how much and how quickly crypto prices are moving.
How did crypto market volatility appear in 2022?
Crypto market volatility in 2022 featured rapid price changes driven by market sentiment and regulatory news. It highlighted the risks and opportunities present during turbulent periods.
What does the Crypto Volatility Index measure?
The Crypto Volatility Index measures the degree of price swings in cryptocurrencies over time. It gives traders a metric for comparing current market turbulence with past trends.
How volatile is the crypto market?
The crypto market is highly volatile, with prices shifting widely in short periods. This high fluctuation is due to continuous trading and varying investor emotions.
What is the most volatile day in crypto?
The most volatile day in crypto usually happens on days with major news or regulatory announcements. Such events trigger fast and significant price moves during a single trading session.
At what time does the crypto market show high volatility?
High volatility in the crypto market tends to occur during peak trading hours when multiple global markets overlap, increasing the volume and speed of price movements.
What is the average volatility of a cryptocurrency?
The average volatility of a cryptocurrency is expressed as the typical daily percentage change in its price. This figure helps traders gauge potential risks when entering a trade.
What are some of the most volatile cryptocurrencies for day trading, like on Binance?
The list of highly volatile cryptocurrencies for day trading often includes tokens actively traded on Binance. Their fast price swings offer frequent quick trade opportunities for experienced traders.
How do coins like XRP, Dogecoin, Ethereum, Solana, Shiba Inu, and Litecoin compare in volatility?
Coins such as XRP, Dogecoin, Ethereum, Solana, Shiba Inu, and Litecoin display differing levels of volatility. Their price shifts depend on market news, project updates, and overall trading volume.

