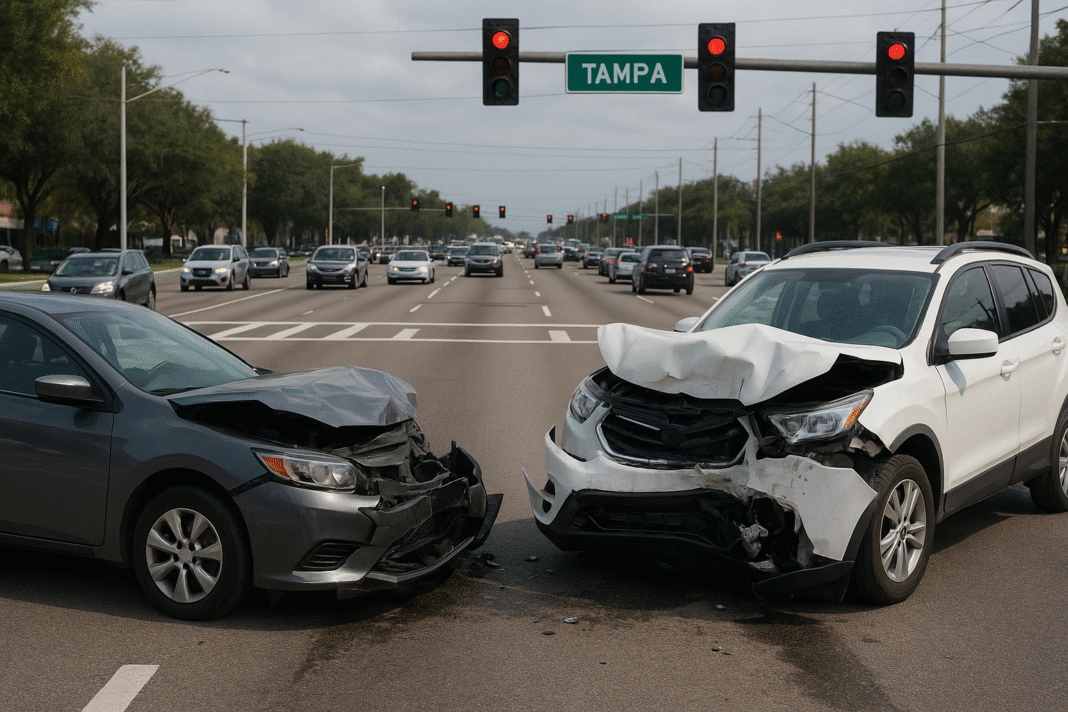
Arizona Ranks First as New Study Identifies the Most Dangerous States for Gig and Delivery Drivers
Arizona has emerged as the nation’s highest-risk state for gig and delivery drivers, followed by Nevada and South Carolina, according to a new nationwide study examining the roadway conditions faced by workers who earn a living transporting passengers, delivering meals and completing app-based orders.
The 2026 analysis, conducted by the Texas Law Dog, evaluated all 50 states and Washington, D.C., using five indicators of roadway danger and occupational exposure. Arizona recorded the highest overall risk score at 75.16 out of 100, ahead of Nevada at 70.00 and South Carolina at 68.38.
Louisiana and Florida completed the five highest-risk states, while Texas ranked ninth with a score of 50.35.
The study comes amid growing concerns about traffic safety for app-based workers, particularly as delivery platforms expand their operations and more workers rely on personal vehicles, bicycles and other forms of transportation to earn income.
National occupational data illustrate the scale of the issue. More than 2.8 million nonemployer establishments were recorded in two industries used as proxies for delivery and rideshare activity in 2023. Meanwhile, emergency-department-treated injuries among courier and messenger workers increased from approximately 13,000 in 2015 to 35,000 in 2022.
Researchers developed a composite risk index incorporating gig and delivery work exposure, speeding fatalities, urban roadway fatalities, pedestrian fatalities and pedalcyclist fatalities. Each component contributed 20% of the final score.
Importantly, the rankings measure the broader road environments encountered by working drivers, not verified collisions involving gig workers specifically.
The Texas Law Dog
The 10 Highest-Risk States and Jurisdictions for Gig and Delivery Drivers
The study identified considerable variation in roadway conditions across the country, with several Southern and Southwestern states occupying prominent positions.
| National Rank | State or Jurisdiction | Risk Score |
|---|---|---|
| 1 | Arizona | 75.16 |
| 2 | Nevada | 70.00 |
| 3 | South Carolina | 68.38 |
| 4 | Louisiana | 63.25 |
| 5 | Florida | 60.71 |
| 6 | New Mexico | 57.60 |
| 7 | District of Columbia | 55.74 |
| 8 | California | 51.02 |
| 9 | Texas | 50.35 |
| 10 | Delaware | 48.66 |
The highest-ranking jurisdictions share several safety characteristics, although the relative contribution of each risk factor varies considerably.
Arizona’s first-place position reflects unusually dangerous urban roadways combined with elevated speeding, pedestrian and cyclist risks.
Nevada’s second-place ranking is associated with both substantial gig-work exposure and dangerous urban driving conditions. South Carolina, meanwhile, ranks third despite having considerably less gig-work exposure than many other states.
These differences suggest that the volume of delivery activity alone does not determine the level of risk workers encounter.
Key Findings From the National Rankings
-
Nine of the 10 highest-risk jurisdictions also ranked in the top 10 nationally for pedestrian fatality risk. Texas was the exception, ranking 13th for that indicator.
-
Seven of the top 10 were among the 10 highest-risk jurisdictions for urban roadway fatalities.
-
Seven of the top 10 also ranked in the top 10 for pedalcyclist fatality risk.
-
Six of the top 10 ranked among the nation’s highest-risk jurisdictions for speeding-related fatalities.
-
Only three of the top 10, Nevada, Florida and Washington, D.C., also ranked among the 10 highest for gig and delivery work exposure.
These findings indicate that the danger extends beyond how many workers are involved in app-based driving. The road networks they navigate and the hazards they encounter while making deliveries also play substantial roles.
Arizona’s Urban Roads Help Drive Its First-Place Ranking
Arizona’s position at the top of the national index is particularly notable because of its performance across multiple roadway safety indicators.
The state recorded an urban roadway fatality rate of 1.560 deaths per 100 million urban vehicle miles traveled, the highest rate of any jurisdiction included in the analysis.
Arizona also ranked third nationally for speeding risk, fifth for pedestrian risk and fourth for pedalcyclist risk.
For drivers navigating metropolitan streets, these factors represent overlapping hazards. Urban deliveries frequently require repeated stops, intersection crossings, lane changes and interactions with pedestrians or cyclists.
Arizona’s combination of high urban roadway fatalities and elevated risks involving vulnerable road users distinguishes it from states where roadway danger is concentrated in fewer categories.
South Carolina presents another important example.
Although the state ranked only 30th for gig and delivery work exposure, it placed fourth for speeding risk, third for urban roadway risk, seventh for pedestrian risk and third for pedalcyclist risk.
Its third-place overall ranking demonstrates how dangerous roadway conditions can outweigh a relatively modest concentration of delivery-related businesses.
Pedestrian and Cyclist Fatalities Reveal Major Safety Concerns
One of the study’s strongest findings involves the relationship between overall gig-driver risk and fatalities among people traveling outside motor vehicles.
National traffic data included in the study documented 7,080 pedestrian deaths and 1,103 pedalcyclist deaths in 2024.
Several of the highest-ranking jurisdictions also reported particularly dangerous conditions for these road users.
| State | Overall Risk Rank | Notable Safety Finding |
|---|---|---|
| Arizona | 1 | 4th for pedalcyclist risk; 5th for pedestrian risk |
| South Carolina | 3 | 3rd for pedalcyclist risk; 7th for pedestrian risk |
| Louisiana | 4 | Highest pedalcyclist fatality rate nationally |
| Florida | 5 | 2nd for pedalcyclist risk; 6th for pedestrian risk |
| New Mexico | 6 | Highest pedestrian fatality rate nationally |
| Texas | 9 | 13th for pedestrian risk; 25th for pedalcyclist risk |
Louisiana recorded the highest pedalcyclist fatality rate in the index, at 0.957 deaths per 100,000 residents.
New Mexico led the nation in pedestrian fatality risk, recording 4.225 deaths per 100,000 residents.
Both states ranked among the six highest-risk jurisdictions overall despite relatively low positions for gig and delivery work exposure.
Louisiana ranked 33rd for exposure, while New Mexico ranked 40th.
The findings are particularly relevant to last-mile delivery operations, which routinely bring workers into contact with pedestrians, bicyclists and congested intersections.
However, the pedestrian and pedalcyclist fatality measures represent statewide road safety outcomes rather than deaths specifically involving delivery workers.
Texas Ranks Ninth With Elevated Speeding and Urban Road Risks
Texas placed ninth nationwide, with a combined risk score of 50.35.
The Texas Law Dog’s analysis found that four of the state’s five component measures exceeded their respective national medians.
Texas’s exposure to gig and delivery activity was also higher than the national median, reflecting the scale of delivery-related operations across the state.
| Risk Indicator | Texas | National Median |
|---|---|---|
| Gig/delivery exposure per 100K residents | 793.46 | 652.90 |
| Speeding fatalities per 100M vehicle miles traveled | 0.485 | 0.322 |
| Urban roadway fatalities per 100M urban vehicle miles traveled | 1.179 | 1.007 |
| Pedestrian fatalities per 100K residents | 2.438 | 1.880 |
Texas’s speeding-related fatality rate was approximately 51% higher than the national median, while its pedestrian fatality rate was approximately 30% higher.
Its urban roadway fatality rate was roughly 17% above the national median.
The state ranked 25th for pedalcyclist risk, a comparatively less severe position than its other safety indicators.
Nevertheless, that result was insufficient to offset its elevated roadway danger across the remaining measures.
Texas’s distracted-driving figures provide additional context. In 2025, the state recorded 86,384 distracted-driving crashes, resulting in 2,437 serious injuries and 299 deaths.
Those collisions involved drivers throughout the state and should not be interpreted as incidents caused specifically by gig or delivery workers.
Which States Have the Lowest Combined Risk?
At the other end of the rankings, North Dakota recorded the lowest composite score, followed by Maine and Idaho.
| National Rank | State | Risk Score |
|---|---|---|
| 42 | Kansas | 20.85 |
| 43 | Ohio | 19.57 |
| 44 | Wisconsin | 17.89 |
| 45 | New Hampshire | 17.52 |
| 46 | Utah | 17.42 |
| 47 | Iowa | 15.36 |
| 48 | Minnesota | 15.33 |
| 49 | Idaho | 14.97 |
| 50 | Maine | 12.07 |
| 51 | North Dakota | 7.25 |
Arizona’s score was more than 10 times North Dakota’s, underscoring the extent of variation in the five-factor index.
That difference does not establish that an individual delivery driver is 10 times more likely to crash in Arizona. The scores are normalized measures of combined roadway conditions and occupational exposure, rather than directly observed crash probabilities.
The geographic distribution also indicates that states with relatively low index scores are not necessarily free of dangerous driving conditions. They simply performed more favorably under the study’s selected measurements.
More Gig Workers Do Not Automatically Mean Greater Road Danger
The study separately evaluated gig and delivery work exposure using nonemployer establishment rates from the U.S. Census Bureau.
New York ranked first for this indicator, followed by Florida, Maryland, New Jersey and Nevada.
| Exposure Rank | State | Establishments per 100K Residents |
|---|---|---|
| 1 | New York | 1,335.60 |
| 2 | Florida | 1,215.00 |
| 3 | Maryland | 1,191.66 |
| 4 | New Jersey | 1,168.24 |
| 5 | Nevada | 1,155.39 |
These figures illustrate where delivery-related and rideshare-related independent business activity is most concentrated relative to population.
They are not exact counts of active platform drivers.
Only Florida and Nevada appeared among the five highest-risk jurisdictions overall.
The difference reinforces the study’s central finding that dangerous road conditions can be just as consequential to the composite ranking as the concentration of gig-related economic activity.
New Mexico and Louisiana demonstrate this especially clearly, with each ranking near the bottom third nationally for exposure but among the six highest for overall roadway risk.
Rising Occupational Injuries Add to Concerns About Driver Safety
Beyond geographic differences, federal occupational data point to an increasing injury burden among courier and messenger workers.
The National Institute for Occupational Safety and Health estimated approximately 182,000 emergency-department-treated occupational injuries in the industry between 2015 and 2022.
Annual injuries increased by approximately 169%, from 13,000 in 2015 to 35,000 in 2022.
Younger workers accounted for a substantial share of the injuries:
-
Workers ages 25 to 34 represented 30% of estimated injuries.
-
Workers ages 18 to 24 accounted for 22%.
-
Men represented 69%.
-
Approximately 14,000 transportation-related injuries occurred during the eight-year period.
The Bureau of Labor Statistics separately reported approximately 77,000 employer-reported injury and illness cases in the courier and messenger industry in 2023.
In 2024, 56 workers in the industry died from occupational injuries, including 35 deaths involving transportation incidents.
Transportation incidents therefore accounted for 62.5% of recorded occupational deaths in the industry that year.
These findings encompass the wider courier and messenger workforce, including workers outside app-based delivery services. They nevertheless provide important context for the hazards associated with transportation-intensive occupations.
What the Rankings Mean for the Future of Delivery Work
The Texas Law Dog’s findings highlight an occupational safety issue extending beyond individual driving decisions.
Although app-based workers may encounter time-sensitive assignments, demanding navigation requirements and repeated pickups, they also operate within transportation systems shaped by speeding, roadway design and the safety of surrounding traffic.
The study’s strongest geographic pattern involved pedestrian fatalities, with nine of the 10 highest-risk jurisdictions also placing among the highest-risk locations for pedestrian deaths.
That concentration suggests that improving safety around intersections, pedestrian crossings, bicycle routes and urban delivery zones could address hazards affecting workers and the broader public.
The findings also demonstrate why statewide rankings must be interpreted through several measures rather than a single crash statistic.
Arizona’s elevated urban fatality rate, Louisiana’s unusually high cyclist fatality rate and New Mexico’s leading pedestrian fatality rate all contributed to their prominent positions.
As delivery services continue to expand, the national results suggest that roadway safety strategies will need to account for both the occupational demands of gig work and the underlying transportation conditions in which that work takes place.